EFTF - Exploring For The Future
Type of resources
Keywords
Publication year
Topics
-
Exploration and management of minerals, energy and groundwater resources requires robust constraints on subsurface geology. Over the last decade the passive seismic technique has grown in popularity as it is one of a handful of non-invasive methods of imaging the subsurface. Given regional imaging relies on comparing records of ground motion between simultaneous deployments of seismometers deployed for over a year, consistency and quality of data collection lies at the heart of this technique. Here, we summarise the standard operating procedures developed by Geoscience Australia over the last 6 years for deployment, servicing and retrieval of passive seismic arrays. Our purpose is to share our experience and thereby contribute to improving the quality of passive seismic data being acquired across Australia. <b>Citation:</b> Holzschuh J., Gorbatov A., Glowacki J., Cooper A. & Cooper C., 2022. AusArray temporary passive seismic station deployment, servicing and retrieval: Geoscience Australia standard operating procedures. In: Czarnota, K. (ed.) Exploring for the Future: Extended Abstracts, Geoscience Australia, Canberra, https://dx.doi.org/10.26186/146999
-
The Officer Basin in South Australia and Western Australia is the focus of a regional stratigraphic study being undertaken by the Exploring for the Future (EFTF) program, an Australian Government initiative dedicated to increasing investment in resource exploration in Australia. This data release provides new data and discusses the results from a new commissioned petrographic study of rock samples from five wells of the Officer Basin including: GSWA Vines 1, Yowalga 3, Birksgate 1, Giles 1, and Munta 1. Data includes petrography, XRD, thin section scans and photos, as well as petrographic summaries
-
This animation shows how Magnetotelluric (MT) Surveys Work. It is part of a series of Field Activity Technique Engagement Animations. The target audience are the communities that are impacted by our data acquisition activities. There is no sound or voice over. The 2D animation includes a simplified view of what magnetotelluric (MT) stations and equipment looks like what the equipment measures and how the survey works.
-
Exploring for the Future (EFTF) is an Australian Government program led by Geoscience Australia (GA), in partnership with state and Northern Territory governments. The EFTF program (2016-2024) aims to drive industry investment in resource exploration in frontier regions of onshore Australia by providing new precompetitive data and information about their energy, mineral and groundwater resource potential. Under the EFTF program, the Onshore Energy Project undertook a study of petroleum prospectivity of the onshore Officer Basin in South Australia and Western Australia. Birksgate 1 well in South Australia was selected based on the occurrence of gas and oil shows reported in the well completion report. Sampling of cuttings and cores was done at Geoscience Australia's Petroleum Data Repository in Canberra. Geoscience Australia commissioned a fluid inclusion stratigraphy (FIS) study on the downhole samples. Here, volatile components ostensibly trapped with fluid inclusions are released and analysed revealing the level of exposure of the well section to migrating fluids. Integration of thin section (TS) preparations reveal to extent of gas and fluid trapping within fluid inclusions while microthemometry (MT) gives an estimation of fluid inclusion trapping temperature. For Birksgate 1, FIS analysis was performed on 414 cuttings and 33 cores between 150 feet and 6161 feet base depth, together with 14 samples prepared for TS and 3 samples for MT. To support this study, lithostratigraphic tops were compiled by Geoscience Australia. The results of the study are found in the accompanying documents.
-
This animation shows how passive seismic surveys Work. It is part of a series of Field Activity Technique Engagement Animations. The target audience are the communities that are impacted by our data acquisition activities. There is no sound or voice over. The 2D animation includes a simplified view of what passive seismic equipment looks like, what the equipment measures and how the survey works.
-
Geoscience Australia’s Exploring for the Future program (EFTF) provides precompetitive information to inform decision-making by government, community and industry on the sustainable development of Australia's mineral, energy and groundwater resources. The Australian Passive Seismic Array Project (AusArray) program developed from a long history of passive seismic imaging in Australia involving many contributors. Building on this history, the Australian Government (EFTF), academia and state governments have united around AusArray. The objective is a standardised and quality controlled national passive seismic data coverage and an updatable national seismic velocity model framework that can be used as a background for higher-resolution studies. The AusArray passive seismic data are supplemented with active seismic data that can provide P-wave and S-wave velocity information for the near surface down to about 50 m depth. This near-surface velocity data will provide constraints for some AusArray passive seismic data modelling to obtain more reliable depth models. This document details the active seismic data acquisition using TROMINO® three-axis broadband seismometers using a wireless trigger and hammer source. Equipment packing, field operations, data extraction and preparation, and Multichannel Analysis of Surface Waves (MASW) modelling are described.
-
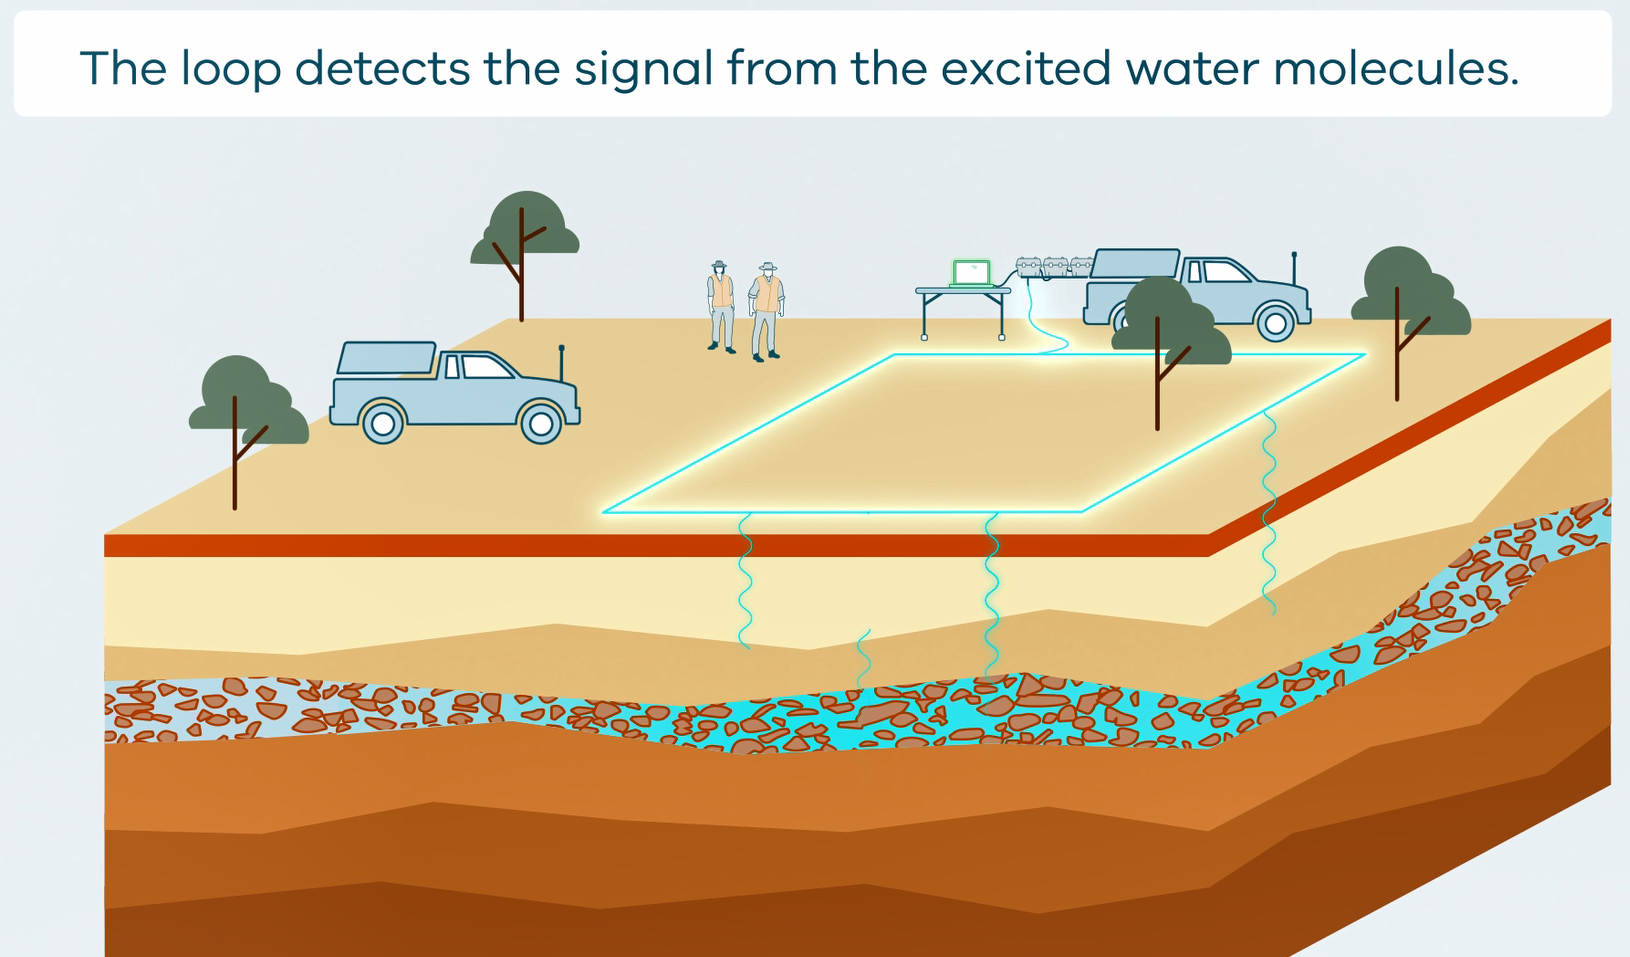
This animation shows how Surface Magnetic Resonance (SMR) Surveys are conducted. It is part of a series of Field Activity Technique Engagement Animations. The target audience are the communities that are impacted by GA's data acquisition activities. There is no sound or voice over. The 2D animation includes a simplified view of what SMR equipment looks like, what the equipment measures and how scientists use the data.
-
This animation shows how Airborne Electromagnetic Surveys Work. It is part of a series of Field Activity Technique Engagement Animations. The target audience are the communities that are impacted by our data acquisition activities. There is no sound or voice over. The 2D animations include a simplified view of what AEM equipment looks like, what the equipment measures and how the survey works.
-
The ISOTOPE database stores compiled age and isotopic data from a range of published and unpublished (GA and non-GA) sources. This internal database is only publicly accessible through the webservices given as links on this page. This data compilation includes sample and bibliographic links. The data structure currently supports summary ages (e.g., U-Pb and Ar/Ar) through the INTERPRETED_AGES tables, as well as extended system-specific tables for Sm-Nd, Pb-Pb, Lu-Hf and O- isotopes. The data structure is designed to be extensible to adapt to evolving requirements for the storage of isotopic data. ISOTOPE and the data holdings were initially developed as part of the Exploring for the Future (EFTF) program. During development of ISOTOPE, some key considerations in compiling and storing diverse, multi-purpose isotopic datasets were developed: 1) Improved sample characterisation and bibliographic links. Often, the usefulness of an isotopic dataset is limited by the metadata available for the parent sample. Better harvesting of fundamental sample data (and better integration with related national datasets such as Australian Geological Provinces and the Australian Stratigraphic Units Database) simplifies the process of filtering an isotopic data compilation using spatial, geological and bibliographic criteria, as well as facilitating ‘audits’ targeting missing isotopic data. 2) Generalised, extensible structures for isotopic data. The need for system-specific tables for isotopic analyses does not preclude the development of generalised data-structures that reflect universal relationships. GA has modelled relational tables linking system-specific Sessions, Analyses, and interpreted data-Groups, which has proven adequate for all of the Isotopic Atlas layers developed thus far. 3) Dual delivery of ‘derived’ isotopic data. In some systems, it is critical to capture the published data (i.e. isotopic measurements and derived values, as presented by the original author) and generate an additional set of derived values from the same measurements, calculated using a single set of reference parameters (e.g. decay constant, depleted-mantle values, etc.) that permit ‘normalised’ portrayal of the data compilation-wide. 4) Flexibility in data delivery mode. In radiogenic isotope geochronology (e.g. U-Pb, Ar-Ar), careful compilation and attribution of ‘interpreted ages’ can meet the needs of much of the user-base, even without an explicit link to the constituent analyses. In contrast, isotope geochemistry (especially microbeam-based methods such as Lu-Hf via laser ablation) is usually focused on the individual measurements, without which interpreted ‘sample-averages’ have limited value. Data delivery should reflect key differences of this kind.
-
Millions of data points have been acquired or compiled through both phases of the Exploring for the Future (EFTF) program at Geoscience Australia (GA). This data that graces the EFTF Portal and appears in many publications has another home within specialist databases designed and built to house the specific data that GA collects. One such database is HYDROCHEM, which was implemented as part of the Enhanced Data Delivery (EDD) and National Groundwater Systems (NGS) projects. HYDROCHEM hosts 190,097 rows of groundwater, surface water and rainfall water chemistry analyses. This data was either previously hosted in the GNDWATER database, or compiled from legacy data stores. The redevelopment of GNDWATER to HYDROCHEM saw the de-duplication and updating of sample and site-specific metadata into other GA databases, such as SAMPLES, BOREHOLES and FIELDSITES. The redevelopment also added additional constraints to the database, including minimum metadata requirements, constrained look-up tables for units of measure, laboratory, method, filter sizes, standards and uncertainty types. Other features include minimum and maximum values for particular analytes and delivery of the data in standardised GA-preferred units of measure.